













5 Key Indicators That Strongly Influence Gold Prices for Investors
Key Takeaways
- In all modern financial investment fields, gold is considered the most effective "golden goose". This assessment stems from many reasons, from liquidity to safety. Investors can clearly see the gold price financial...

In all modern financial investment fields, gold is considered the most effective "golden goose". This assessment stems from many reasons, from liquidity to safety. Investors can clearly see the gold price financial charts below, ranging from gold reserves, cash, and current general financial issues.
Cash Reserve Charts Reflect the End of the Easy Money Era
Easy money refers to a high level of cash reserves in national banks.
This phenomenon usually arises from the expansion of national credit and the widening of cash reserves within national banks.
This typically leads to lower interest rates, making it easier for investors to access funds.
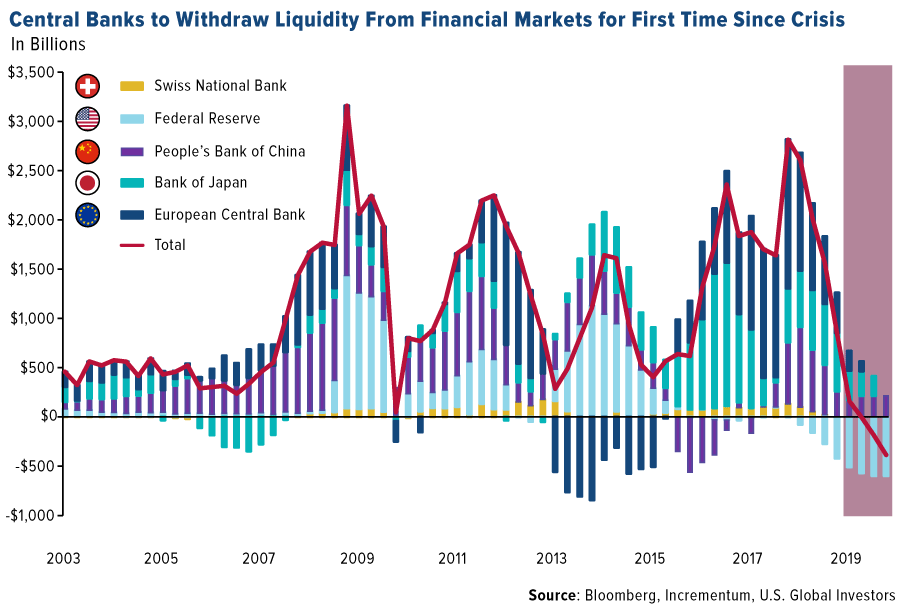
Financial chart of national cash reserves from 2003 – 2020
The role of easy money is to stimulate economic development through cash conversion. In a stable economy, easy money is very common and easily stimulates demand and development.
However, in recent times, the lingering effects of the 2008 financial crisis have forced banks to ease interest rates.

Abundant cash helps countries operate more stably
But at this point, those banks are beginning to tighten lending rates. The Fed decided to maintain interest rates in the US from 1% to 0.25% on March 15th.
With returns diminished, investors need an alternative. Therefore, gold bars are considered an excellent investment idea today.
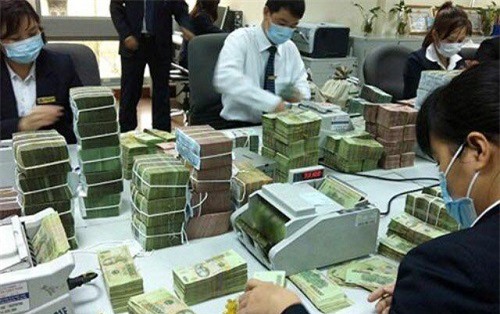
Work scene at a national bank
Especially as COVID-19 has profoundly and severely impacted the global economy. But thanks to COVID-19, people are beginning to see the role of gold bars more clearly.
Because of its high reserve value, unaffected by national GDP or corresponding policies.
Gold Reserve Charts Reflect Rising Demand for Gold
For many countries, gold bars do not directly impact the national GDP. And it is also the safest choice for national asset security. Therefore, in recent years, there has been a significant wave of gold reserve purchases globally.
According to the gold price financial chart below, the reserves have seen a sharp increase in the past two years.
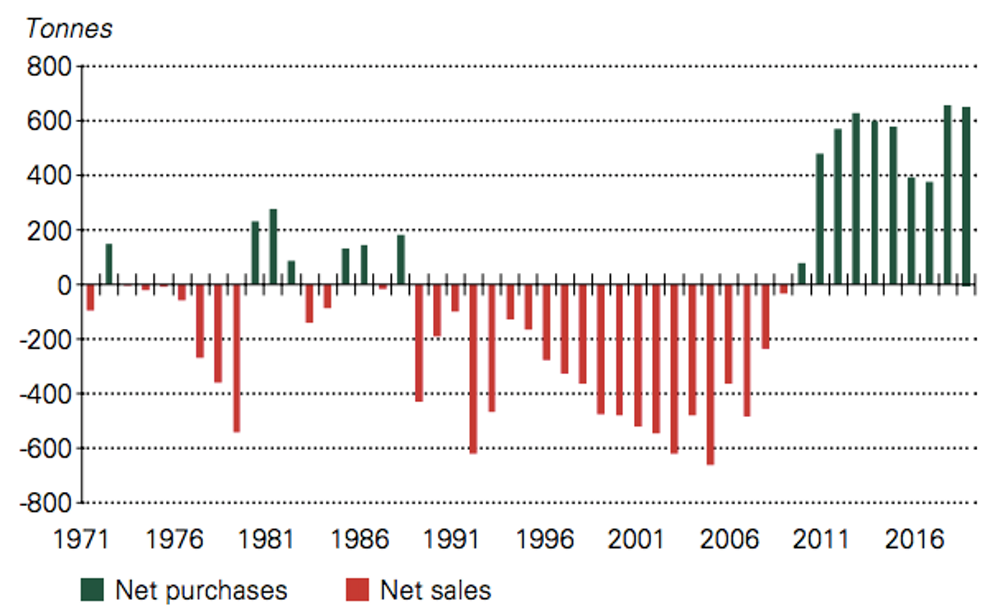
Chart of total gold bar reserves of national banks from 1971 – 2016
In 2018, the total national reserves reached 656 tons of gold, and in 2019, it was 650 tons.
And looking back, in 2008, the price of gold fell from $1,019 to $694.
In 2018-2019, the price of gold increased sharply and followed a cycle. From $1,127 in January 2017 to $1,364 in February 2018.
In 2019, the price of gold was $1,340 but then increased dramatically from the end of the year into the next.
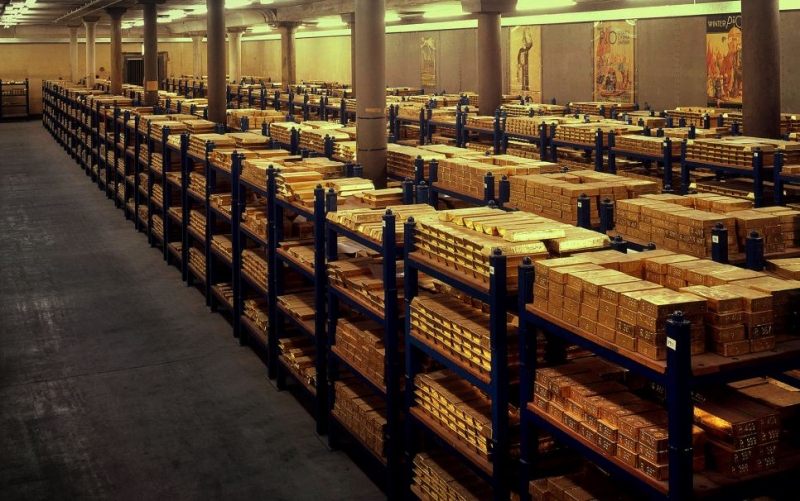
Inside a national bank's gold bar storage facility.
According to Incrementum, the increase in gold reserves sends an implicit message: "The US dollar is losing value."
This is partly due to the US's diminishing role on the current global stage. First, its withdrawal from the TPP (2017), UNESCO (2018), and most recently the WHO in the context of COVID-19.

Gold bars stored in gold vaults
And every time countries buy gold, the price of gold increases.
Specifically, in 2003, the price of gold bars was only $350, when total reserves were negative at 600 tons. By 2011, total reserves recovered and reached about 500 tons, with the price of gold rising to $1,900.
Global Debt Charts Make Gold Safe
National public debt is the total value of external borrowings of a country. The purpose of borrowing money is to address budget deficits and develop infrastructure.
The total global public debt in 2000 was 13,000% of global GDP, equivalent to 63 quadrillion USD.
As of today, public debt has reached $77 quadrillion, equivalent to 10,000% of GDP.
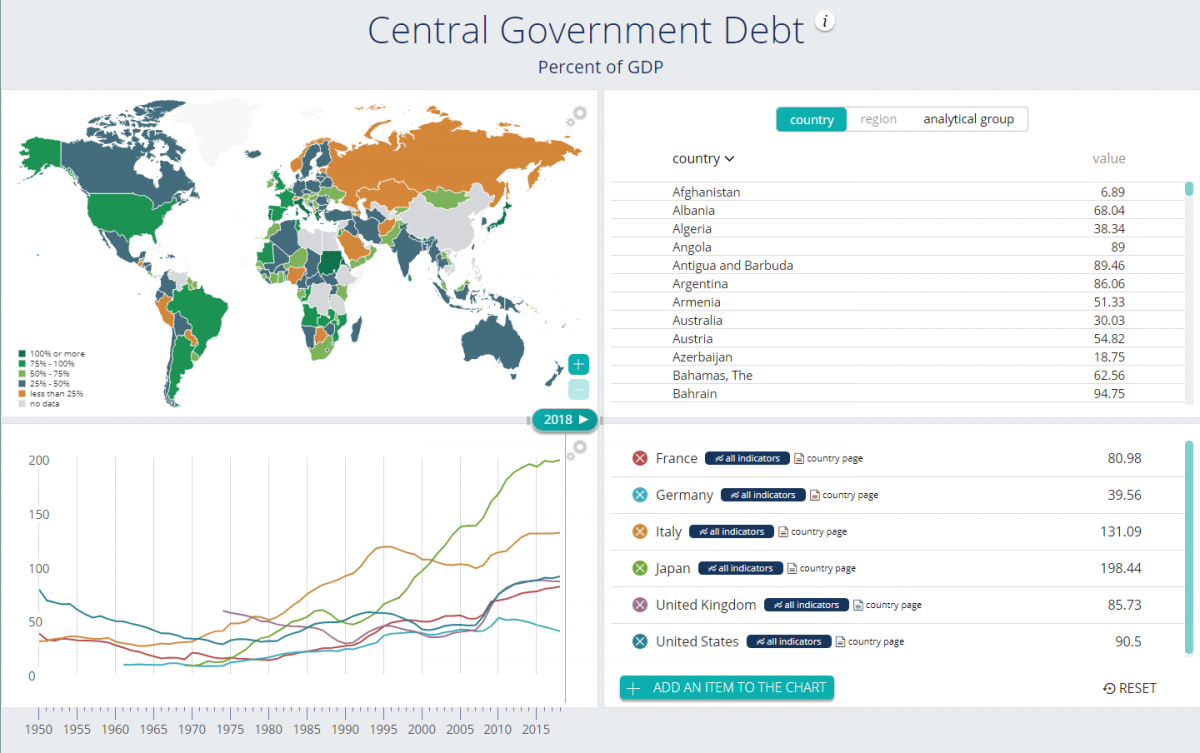
Chart of global public debt from 1950 – 2015
On the positive side, public debt increases a country's resources for development.
For developing countries, public debt is a reasonable solution for infrastructure projects and financial resource development investment.
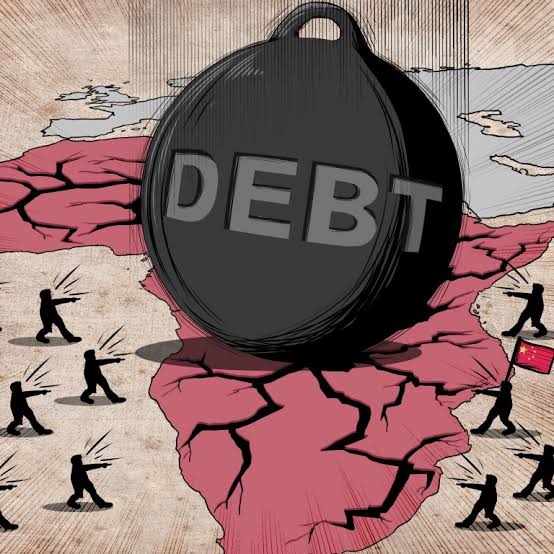
National public debt is the total value of external borrowings of a country
However, public debt creates certain pressures on monetary and fiscal policies.
Looking at the historical fluctuations of previous countries clearly shows this.
Public debt reduces the consumption capacity of many countries due to exports to repay debt and the depletion of cash funds converted into national bonds.

Public debt creates pressure on the finances and policies of each country
From 1976 to 1980, the international gold price increased 8 times amidst rampant inflation. The 2007 financial crisis and the 2010 EU sovereign debt crisis were periods when gold prices rose very high.
Looking at history, it is not difficult to conclude that gold prices will be impacted and will increase. This is inevitable and will happen sooner or later.
Currency Devaluation Charts Make Gold Important
Typical financial data suggests that when the US dollar increases, the price of gold decreases.
However, this is not entirely accurate because recently, even though the US dollar has been increasing, why has the price of gold also increased?
This is because many other countries around the world are facing crises.
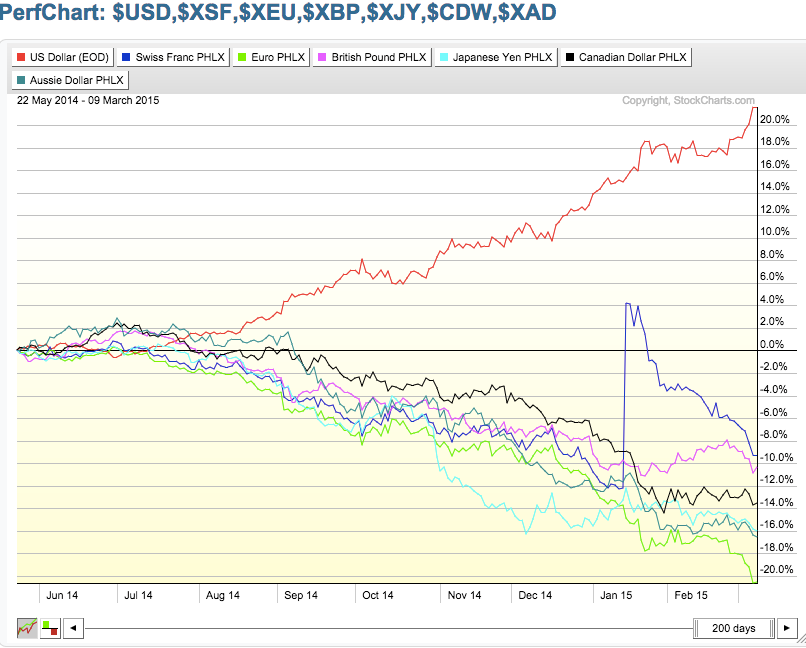
Chart showing the change in currency value of USD, Euro, Franc… from 2014 – 2015
Many currencies of countries are also falling sharply, such as Argentina (~50%), Turkey (40%), Brazil (20%), India (10%)…
This is considered an indirect reason for the current rising gold prices.

Asian currencies are gradually losing value
The reasons given are that after political crises and the consequences of globalization, strong pressures and competition have emerged. This makes using currency as a channel for financial reserves or investment no longer considered a wise choice.
Therefore, the options that investors worldwide are interested in are asset channels that can hedge against inflation or have cross-border transaction capabilities.
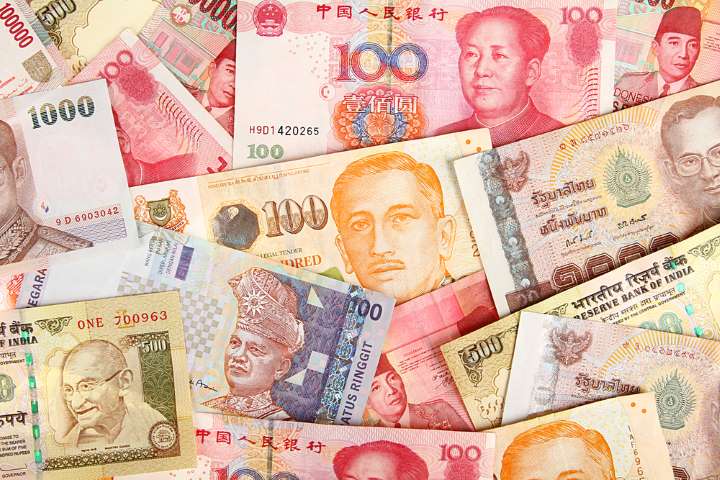
Devalued currencies lead to the rise of gold bars
And the asset channel that is being targeted at this time is gold bars, due to their high liquidity, stable safe-haven status, and significant reduction of financial risks.
Gold-Silver Price Ratio Charts Show Correlation
The gold and silver price financial chart below shows that the years 2000, 2004, and 2015 were the best times to invest in gold, as these were before significant price increases.
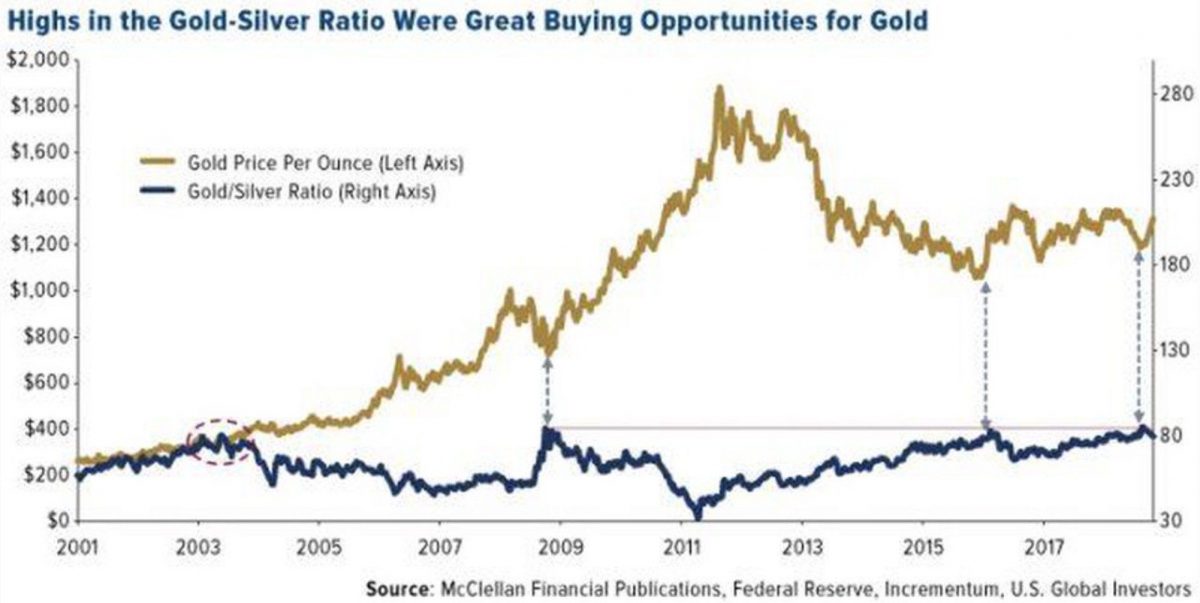
Gold-silver price chart from 2011 – 2017
But in this chart, there is another equally important piece of information.
That is the ratio between gold and silver at that time, which was over 80. This means when it took over 80 ounces of silver to buy 1 ounce of gold, it was the best time to buy gold.
Along with other parallel financial theories, when one sector increases, the other sector will be pulled down.
This can be clearly felt with the theory of interconnected containers in finance, where the three sectors of gold, stocks, and foreign exchange directly influence each other.
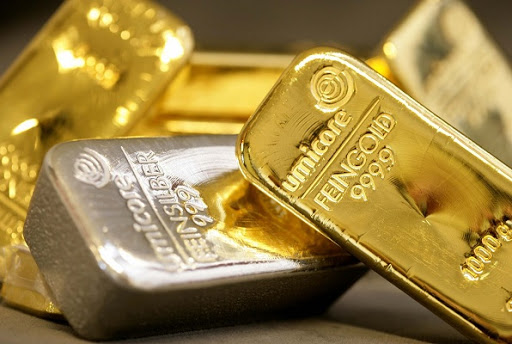
Gold and silver are directly linked
But besides the other two sectors, the price of silver in recent years has somewhat clearly shown a trend: this investment choice also directly impacts today's gold prices. (Refer to international and domestic gold prices here to always be proactive in your strategy and tactics).
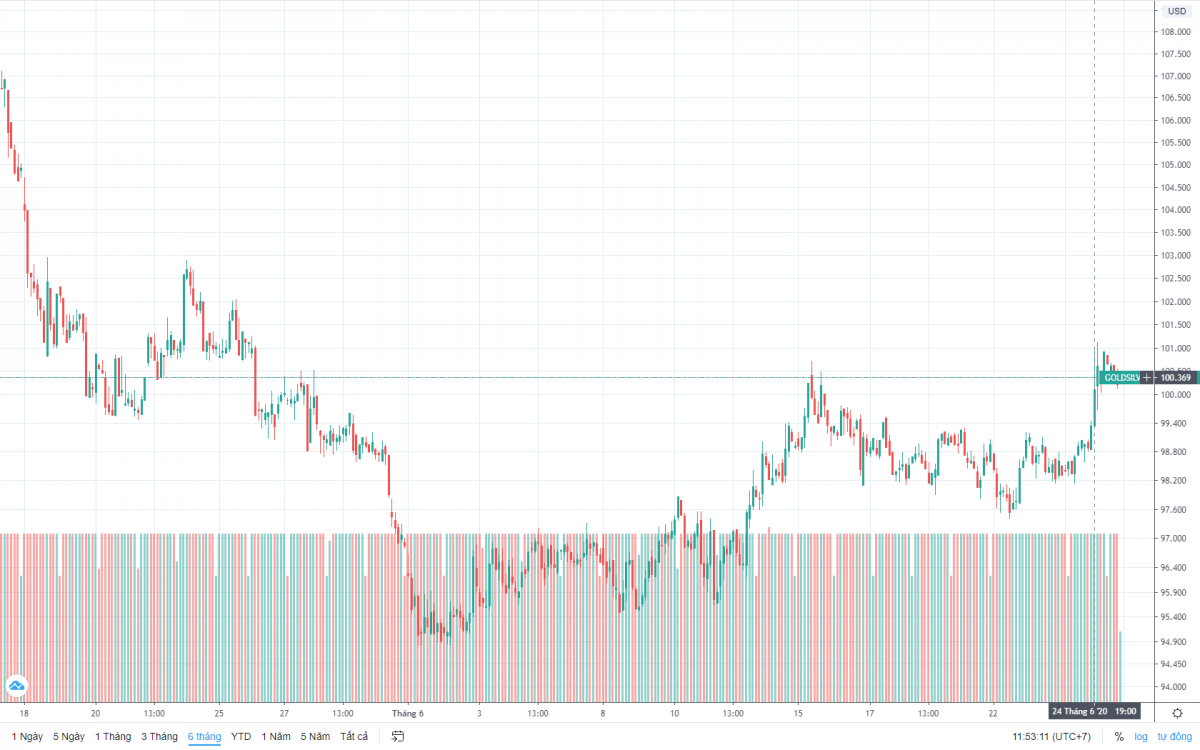
Gold-silver price difference from 2008 – 2020
The current price of silver is around $19, while the price of gold is $1,756 per ounce.
The current market ratio is 92. This ratio aligns with the general gold and silver price chart above, indicating that gold prices will increase.
This is further reinforced by looking at current fluctuations.
We see that the price of gold has a rising trend and the gold-silver ratio will not decrease.
The above 5 gold price financial charts are compelling evidence to assess that investing in gold currently is effective and brings high returns. Therefore, for those who need more data and charts to be sure of their decisions.
Whether investing in gold, a financial sector, is worthwhile. This is the most suitable and certain answer you will ever have.
Based on the gold price chart, we can identify many useful things for future investment plans.
Thank you for reading to the end! Wishing you success as a gold investor.