












Cup and Handle Pattern on Gold Price Chart
Key Takeaways
- The Cup and Handle pattern is one of the common price patterns on the gold price chart. Knowledge and how this pattern operates will greatly assist investors. Especially in analyzing how the...

The Cup and Handle pattern is one of the common price patterns on the gold price chart. Knowledge and how this pattern operates will greatly assist investors. Especially in analyzing how the gold market is shifting. And there are necessary data points to effectively take profits in the financial market.
Cup and Handle Price Pattern on Gold Price Chart
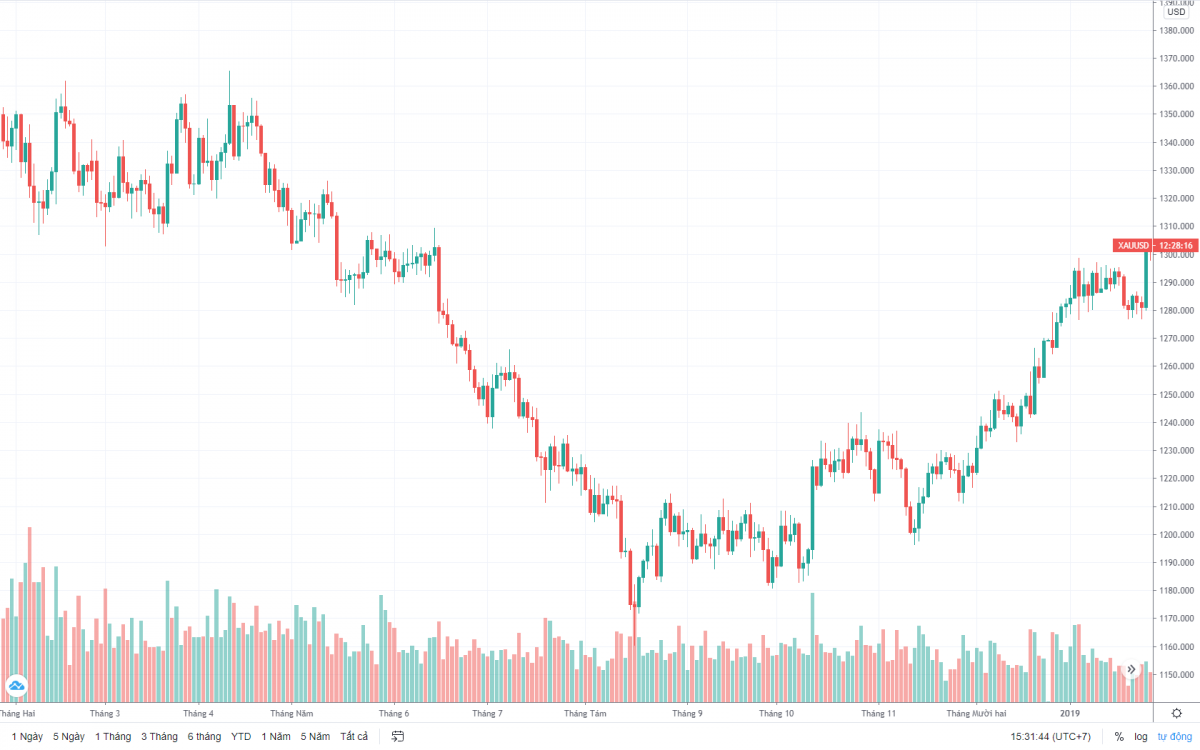
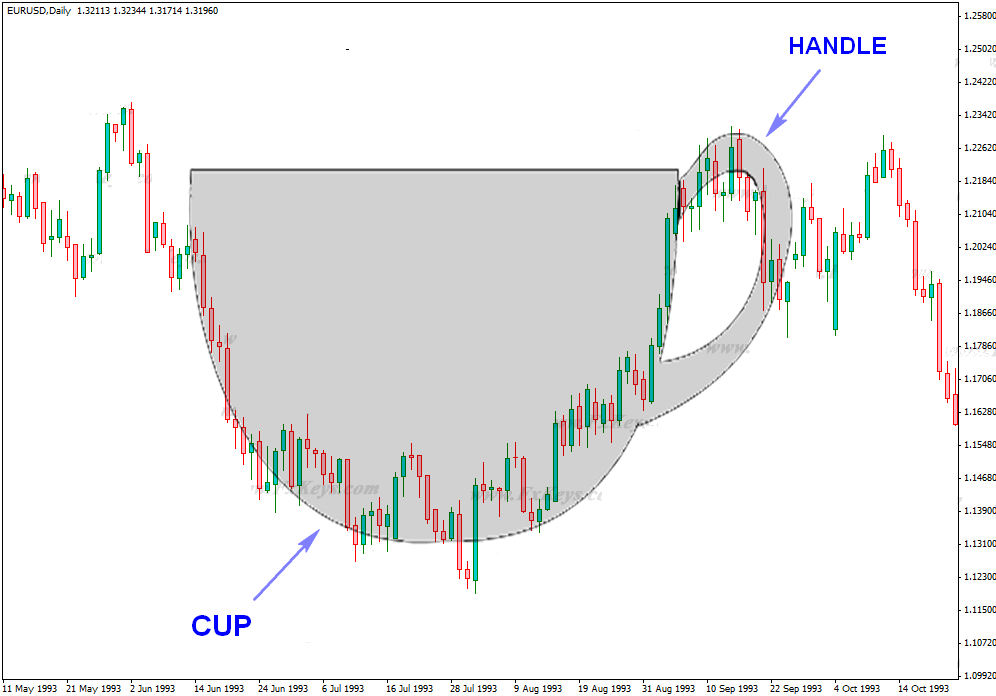
The Cup and Handle price pattern reflects an upward trend on the gold price chart. There will be a margin of error when displaying this pattern, but the common point is the U-shape. Specifically:
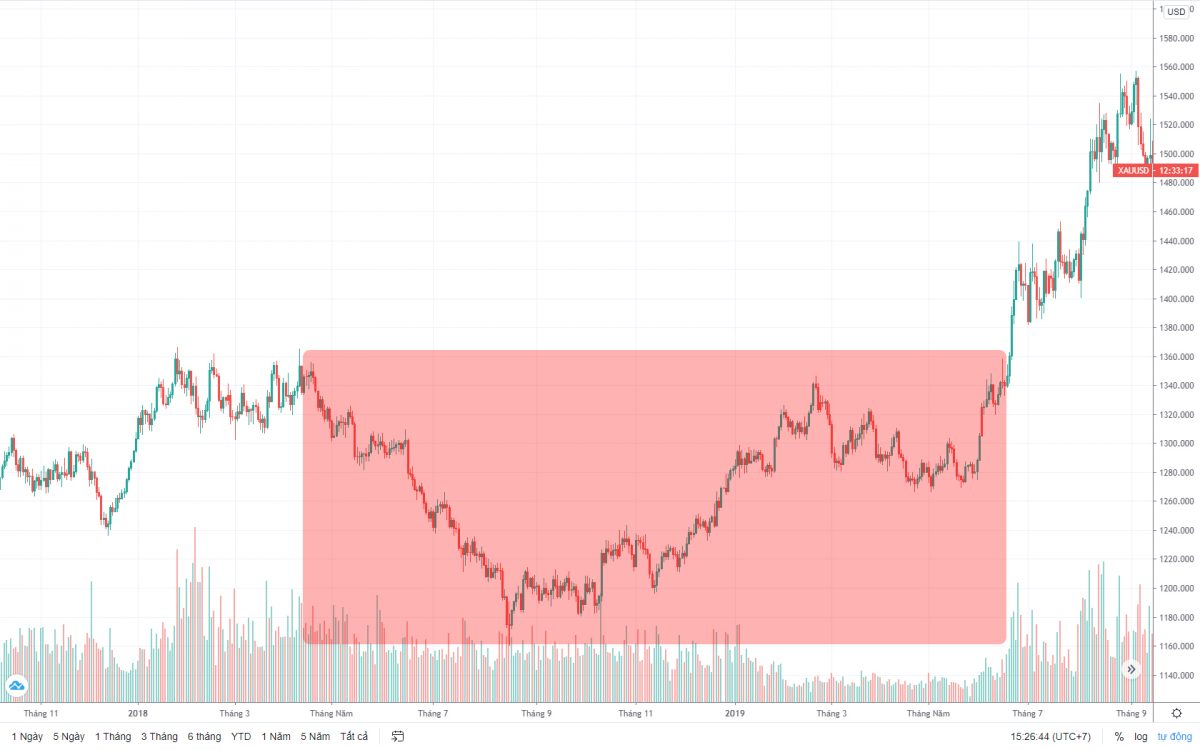
Typical Cup and Handle pattern on the gold price chart
- The price pattern begins with the first resistance point, then tends to decrease steadily.
- The fluctuation touches the support point, then increases steadily again, but at a level equal to the starting point.
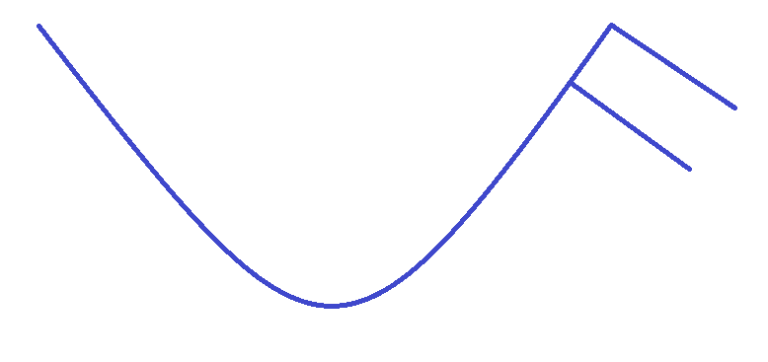
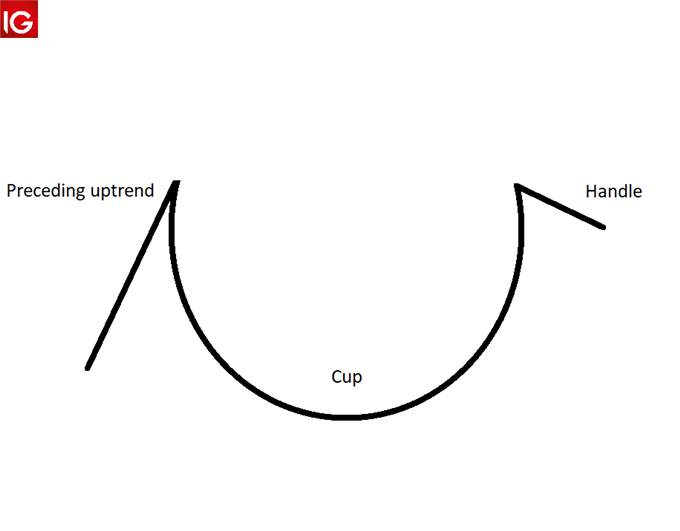
Cup and Handle pattern vector
- The gold price fluctuation touches the second resistance point, slightly decreases, and then increases again.
- In the first fluctuation, the gold price fluctuation forms a moderate U-shape. This phase is called the Cup, as it resembles a cup.
- In the second fluctuation, the gold price fluctuation forms a smaller U-shape. This phase is called the Handle, as it resembles a cup handle.
The Cup and Handle pattern has characteristic properties, so investors can observe and practice accordingly to take profits effectively.
According to William O’Neil’s analysis (2002), the Cup and Handle pattern takes a relatively long time to form.
This pattern takes 7 to 65 weeks to form, with an average of 12 to 24 months. The difference between the resistance and initial support points is 12-15%, exceptionally up to 33%.
Kirkpatrick & Dahlquist assess that fluctuations during the Cup phase are stronger and wider. However, in reality, more trading volume occurs during the Handle phase. Bulkowski’s research indicates that after the initial support point, the price of gold bars increases by about 34%.
Trading Trend on the Gold Price Chart When the Cup and Handle Pattern Appears
The trading trend of investors when the Cup and Handle pattern appears is relatively consistent. Understanding the general trading trend will help you better control the gold bar market.
Accordingly, analysts point out the following commonalities.
- Before the support level in the Cup phase, the gold price decreases slightly and shows no sign of increasing.
- After the support level in the Cup phase, the gold price slightly increases, building confidence for investors. At this point, if the COT index is large enough, it will create growth momentum for the gold market.
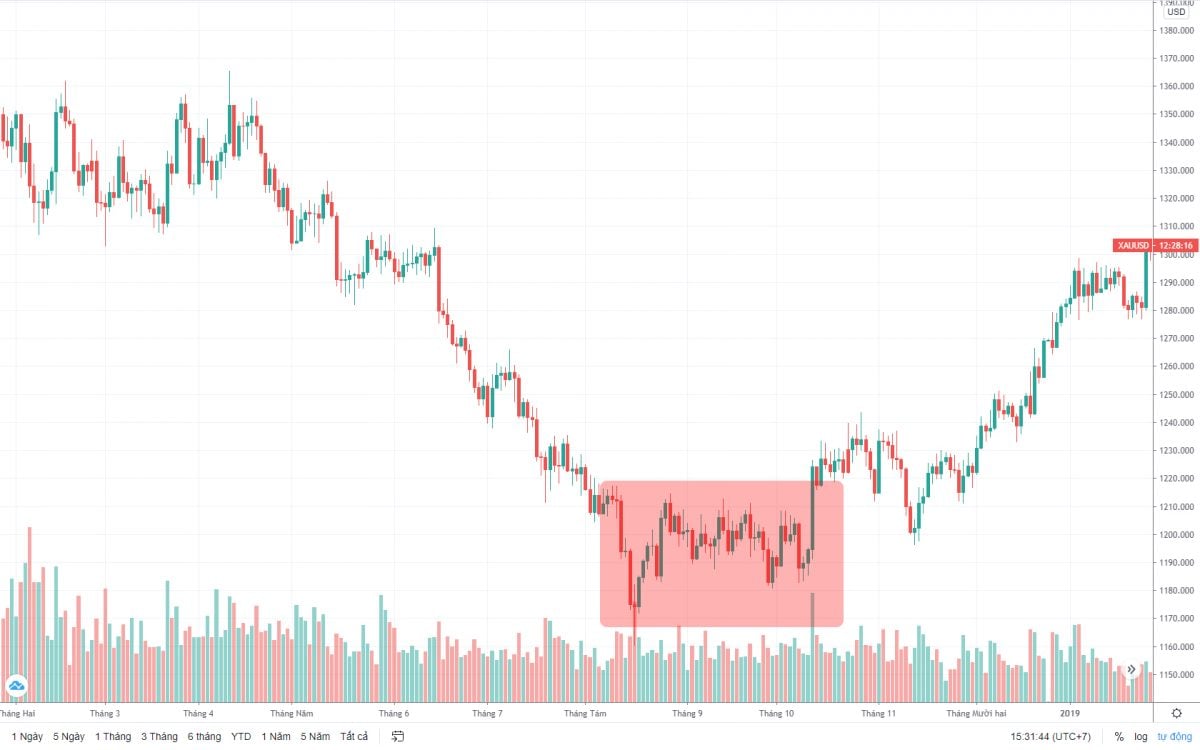
At the resistance level in the Cup phase, the price tends to stabilize
At the end of the Cup phase, investor sentiment and gold price fluctuations usually follow:
- When the resistance level in the Cup phase appears, the gold price stagnates, and investors sell more. The Handle phase will appear immediately after.
- The Handle phase will encourage investors to sell for profit. The COT index sold during this phase is higher than bought.
At the end of the Handle phase, gold price fluctuations will tend to:
- If the resistance level of this phase is broken, the gold price will tend to increase. Investors will then sell more for profit, avoiding the risk of sudden price drops.
- If the resistance level of this phase is not broken, a downtrend will appear. Investors will incur losses due to hesitation while waiting for the gold price to increase further.
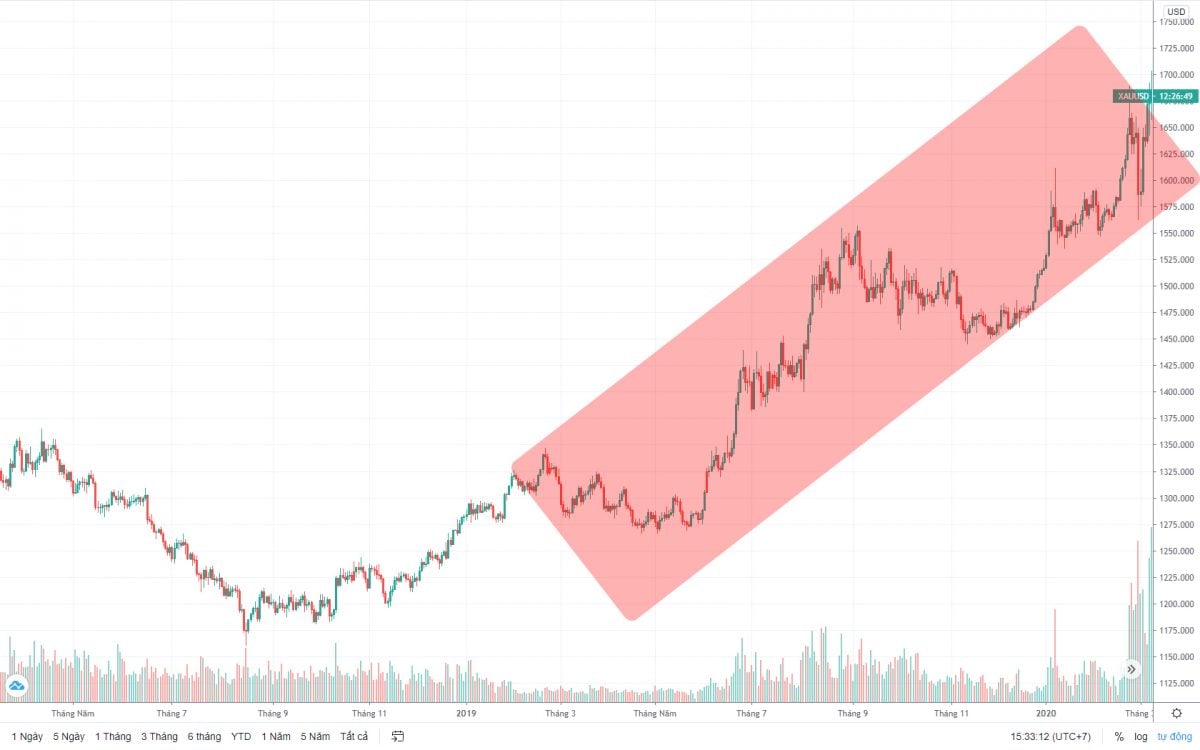
At the end of the Handle phase, the gold price tends to increase strongly.
Cup and Handle Price Patterns on Gold Price Chart
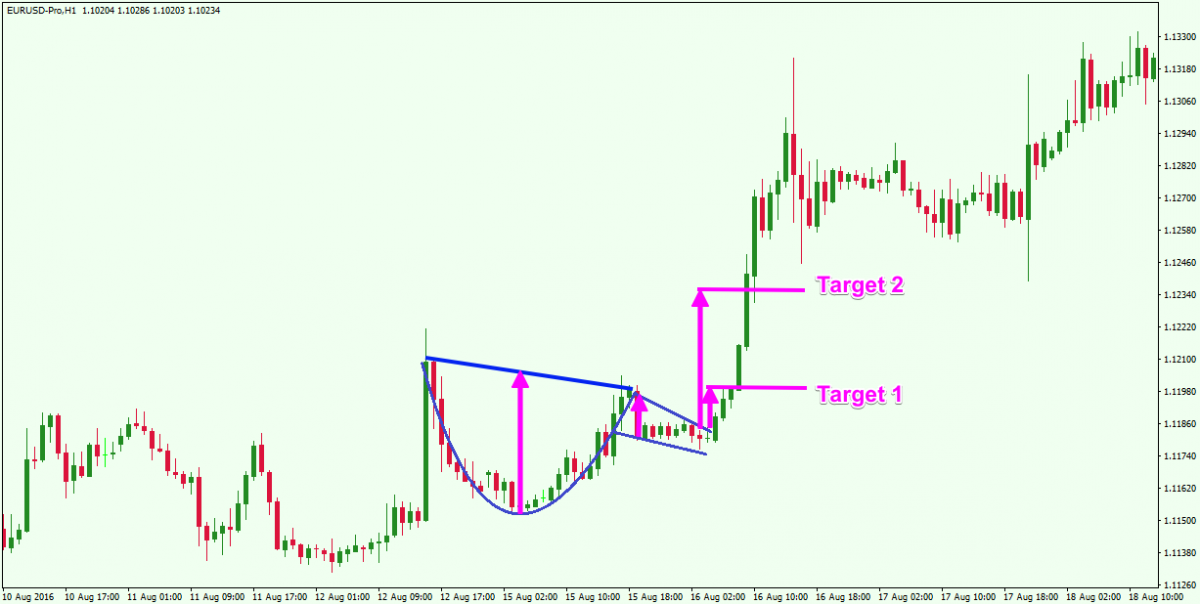
Bullish Cup and Handle Pattern
The Bullish Cup and Handle pattern appears when two conditions are met: a resistance level appears and the gold price fluctuation is reversed. When a resistance level appears, an upward trend will emerge, and from there, the Cup phase will also be formed.
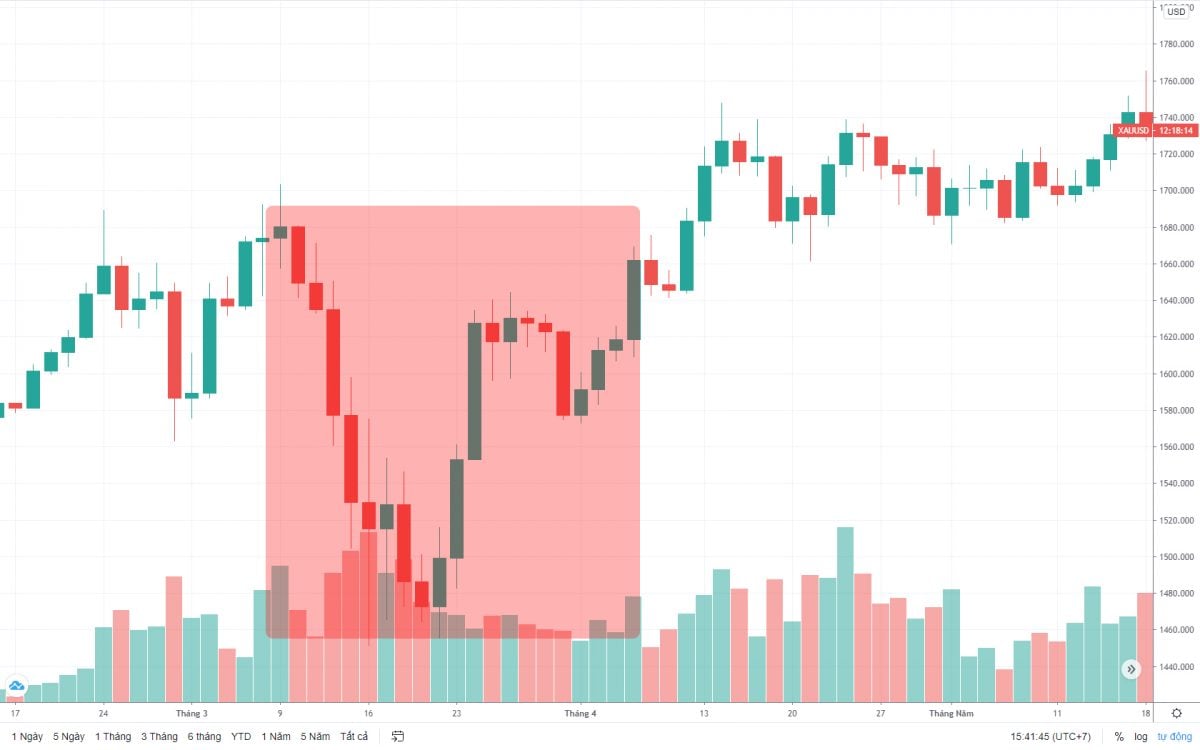
The Bullish Cup and Handle pattern is a classic, standard cup pattern.
This movement then begins to form the Handle phase immediately after, creating a price trend with a downward direction. This pattern is identified when the price breaks above the resistance level of the Handle phase, creating upward momentum. The upward trend can last as long as the size of the downward fluctuation in the Cup phase.
When you confirm the pattern, the price can break through the handle's downtrend channel, initiating an upward movement. The upward trend can extend by the size of the downtrend channel or be equivalent to the size of the cup phase starting from the breakout point.
Bearish Cup and Handle Pattern
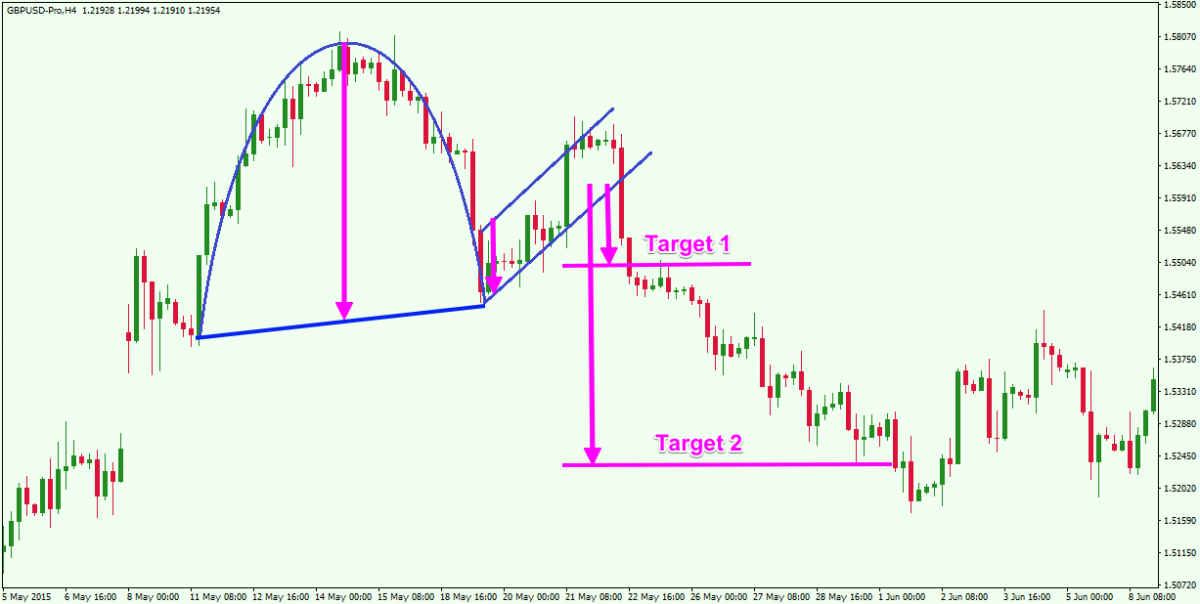
The Bearish Cup and Handle pattern on the gold price chart operates similarly to the Bullish pattern, but in reverse. The conditions for the Bearish Cup and Handle pattern to appear include: the emergence of a support level, and the gold price reversing. When a support level emerges, the gold trend will decrease, and this is when the Cup phase peaks.
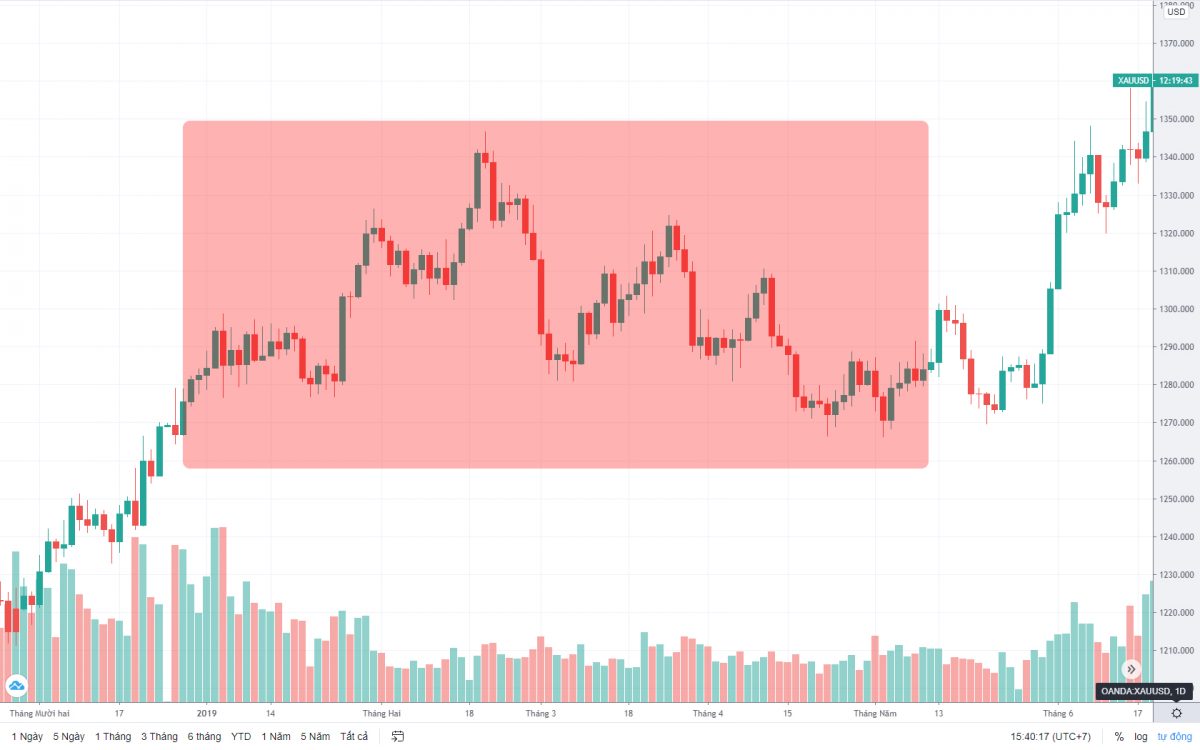
The Bearish Cup and Handle pattern is an inverted cup pattern, indicating a downward trend.
At the end of the Cup phase of this pattern, a resistance level will appear, and the price will be pushed back. The gold price fluctuation during the Handle phase will tend to be ½ compared to the Cup phase. When the Handle phase ends, the gold price will decrease sharply and be difficult to recover.
Trading Method with the Cup and Handle Price Pattern on Gold Price Chart
Once we understand the fluctuations of the Cup and Handle price pattern, the trading method will become clearer. Therefore, after identifying that the gold fluctuation will follow the Cup and Handle price pattern, we will do the following.
For Buy Orders on the Gold Price Chart
The most perfect trade is when a support level is formed, at any stage. Many investors think the Cup phase is the perfect phase for trading.
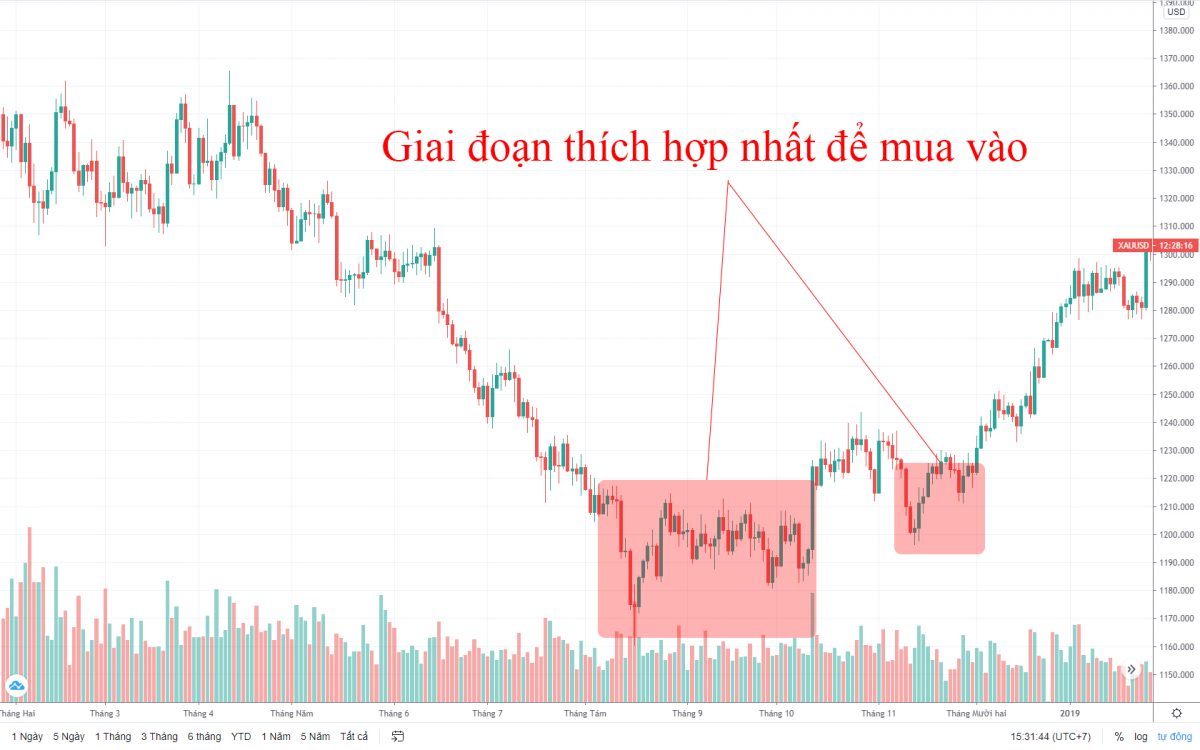
When a support level is formed, buy gold immediately at any stage.
However, at this point, the Cup and Handle pattern has not fully formed, so there is a risk. Therefore, buy orders during the Cup phase can help investors take profits better.
But with that comes risk. As for the Handle phase, the market is clearer, and the fluctuations are more visible.
For Sell Orders on the Gold Price Chart
The most perfect trade is when the resistance line is broken, or at the end of the Cup phase. At this point, the gold price across the entire chart will reach its highest level in the price pattern.
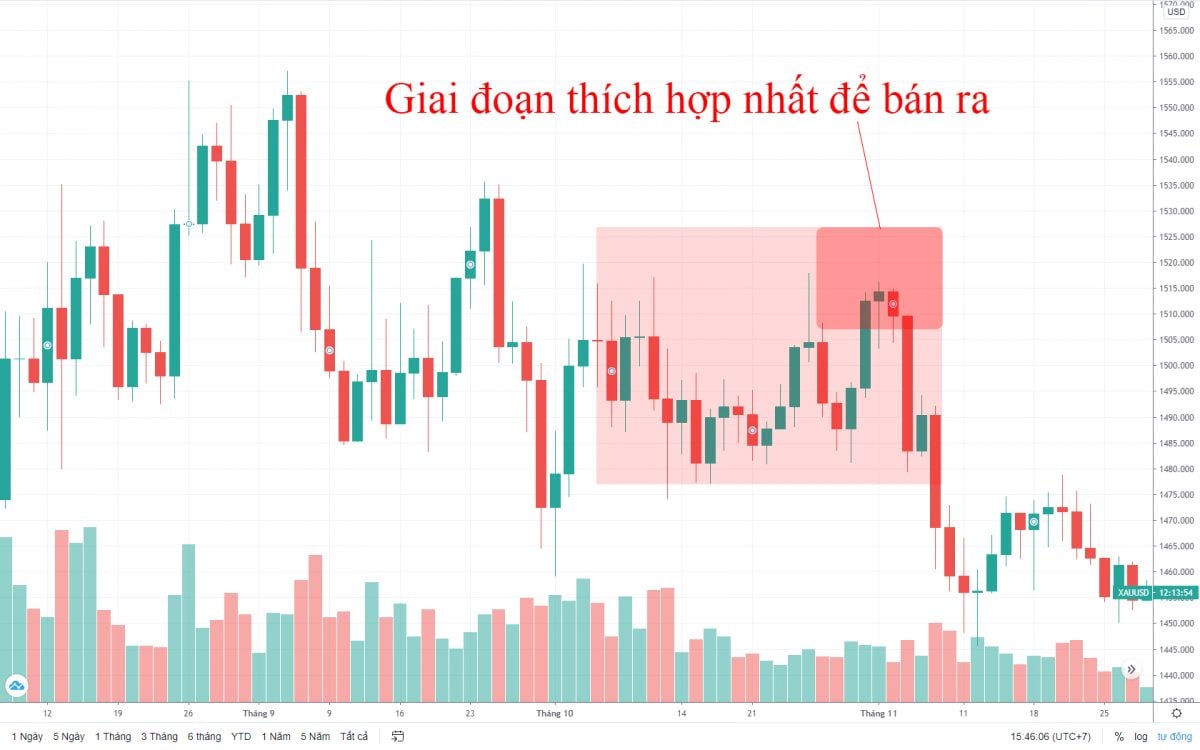
When the price reaches the resistance level, it is a suitable time to sell gold.
Unlike buy orders, sell orders are formed when the Cup and Handle pattern becomes clear. Trading orders at the resistance line will involve risk, but can also yield better profits.
Trading orders at the end of the Cup phase will be more in line with the plan and yield complete profits.
Advantages and Disadvantages of Trading with the Cup and Handle Pattern on Gold Price Chart
Advantages of the Cup and Handle Pattern
The Cup and Handle pattern combines volatility signals and technical indicators. This creates superior advantages compared to other analysis patterns. Specifically as follows.
- Scientific progression: As a technical indicator, the Cup and Handle pattern will inherently possess a high degree of scientific nature. This leads to high accuracy, minimal error, and low risk in providing forecasts.
- Recurring cycles: Clearly, the Cup and Handle pattern is influenced by market fluctuations. This is not mentioned in the article, but it does not mean it is less important. These fluctuations tend to repeat, and investor psychology will be similar. Therefore, the Cup and Handle pattern creates a recurring nature on the gold price chart.
- High stability: Both an advantage and a disadvantage, but the formation time creates stability. Accordingly, once this pattern is identified, it will be fully maintained. It is very difficult for the Cup and Handle pattern to form and then be broken, with incorrect structures, etc.
Besides the gold price chart, the Cup and Handle pattern is also applied in many other financial fields.
Disadvantages of the Cup and Handle Pattern on Gold Price Chart
It can be said that the advantages of the Cup and Handle pattern also create disadvantages. Specifically, the disadvantages that investors need to avoid are as follows.
- Time-consuming to form: As mentioned above, the Cup and Handle pattern requires a minimum of 1 month to form. This is the lowest timeframe, while the average is usually around 1 year. In the context of financial fluctuations and investment projects, this will be a high challenge for investors in evaluating the pattern.
- The pattern with a low difference between resistance and support levels helps investors take profits more effectively. This can easily create risks as many investors decide to take profits faster.
This can be considered the most versatile pattern among financial technical indicators.
Notes When Trading with the Cup and Handle Pattern on the Gold Price Chart
One of the things you need to ensure before entering a trading session based on the Cup and Handle pattern is that the value of gold bars has fluctuated by at least 10% compared to before. This price ensures a good buffer, supporting strong future growth.
Furthermore, no pattern unfolds perfectly as predicted. The important thing you need to focus on is protecting your capital. This will help you minimize potential risks when trading during volatile periods.
Therefore, do not hesitate to cut your losses as soon as you notice many unstable fluctuation signals.
Applying the standard Cup and Handle pattern helps investors take profits more effectively.
In addition, you also need to follow economic, political, and social shifts to keep up with market developments. This will help financial decisions be more complete, attractive, and highly accurate. You will also avoid many risks and instabilities when investing.
With the information above, we hope you know how to invest more effectively and with higher quality. This will be of great help in restoring personal finances after the Covid 19 pandemic. In addition, do not rush to make hasty transactions.
With the Cup and Handle pattern, the most important thing is calmness, slowness, and certainty.