














Gold Price Chart Analysis: Trends and Real-time
Key Takeaways
- Observing gold price charts is an effective method to approach and predict future gold prices. Trend and real-time charts are two basic forms that investors need to pay attention to in order...

Observing gold price charts is an effective method to approach and predict future gold prices. Trend and real-time charts are two basic forms that investors need to pay attention to in order to understand clearly, so that all their decisions will be more appropriate and complete.
Gold Price Chart Trends
When observing gold price charts, one of the points that analysts need to pay attention to is the trend line. This line reflects the trend of gold price changes today and on other days in the market. Along with that, analyzing price peaks and average lines will help you have more reference parameters.
Ignore the mathematical details shown on the chart, as fluctuations depend largely on trend changes, market sensitivity, and a bit of government regulation. Regarding the chart's directional trend, there are three main directions: upward, downward, and sideways. The meaning and message of these charts are as follows:
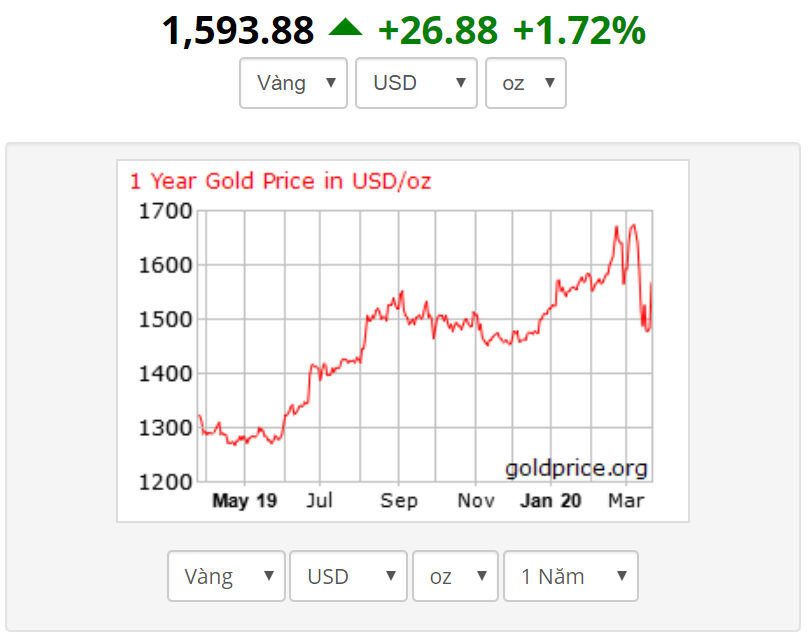
Regarding the chart's directional trend, there are three main directions: upward, downward, and sideways.
An upward gold price chart reflects that the gold price tends to increase over time and fluctuates little downwards. Accordingly, selling during this period is a reasonable decision, but it is necessary to consider and judge the appropriate peak point to optimize the product's value.
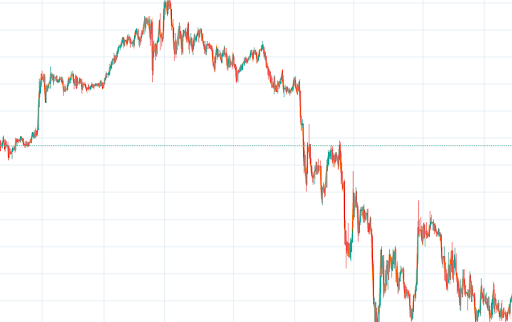
A decreasing gold price chart shows the opposite direction of the gold price trend – a decline and potentially hitting a gold price bottom in certain cases.
A decreasing gold price chart shows the opposite direction of the gold price trend – a decline and potentially hitting a gold price bottom in certain cases. By monitoring this chart and identifying the appropriate bottom point and making a decision to buy gold during that period, one can approach and acquire a quantity of gold with a very reasonable and affordable value. Do not think that buying gold when prices are falling is risky, because gold prices are a reliable and very safe investment choice, with the potential for high profits if bought and sold at the right time.
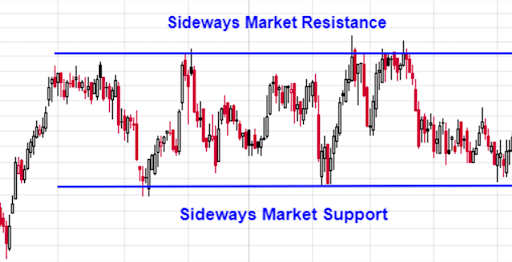
A gold price chart with a sideways trend shows the stability of gold prices over a certain period.
A gold price chart with a sideways trend shows the stability of gold prices over a certain period. During this time, trading gold for profit is not a reasonable choice. However, it is very useful if gold is used as an intermediate unit of exchange and transactions are valued based on the gold exchange rate.
Real-time Gold Price Charts
Analyzing gold prices using real-time charts will help observers accurately predict price fluctuations by cycle. The way to use real-time charts for analysis is to analyze fluctuations and use specific technical indicators.
Common timeframes used in real-time charts include:
- Minute charts (1 minute, 3 minutes, 5 minutes, 15 minutes, 30 minutes).
- Hourly charts (1 hour, 3 hours, 6 hours, 12 hours, 18 hours).
- Daily charts (1 day, 3 days, 5 days).
- Weekly charts (1 week, 2 weeks, 3 weeks).
- Monthly charts (1 month, 2 months).
- Quarterly charts (1 quarter, 2 quarters, 3 quarters).
- Yearly charts (1 year, 3 years, 5 years, 10 years, 15 years…).
Depending on the timeframe and the period of fluctuation, observers will rely on it to predict trading styles and price fluctuation trends. For intraday trading, hourly and minute charts are preferred for analysis, as they reflect proximity and closeness to the trading order that needs to be decided. For long-term trading sessions or in-depth analysis, daily, monthly, or even quarterly or yearly charts are suitable and meet the necessary analytical criteria and requirements.
Depending on the timeframe and the period of fluctuation, observers will rely on it to predict trading styles and price fluctuation trends.
Accordingly, understanding these charts will be an appropriate approach to help us make suitable investment decisions and optimize profits for ourselves and the projects we are following.