












Gold Price Chart When Fed Adjusts Low Interest Rates
Key Takeaways
- Amidst the global economic crisis, due to the current Covid pandemic. Fed Chairman Jerome Powell announced consideration of yield curve control. This action would result in a very deep negative real interest...

Amidst the global economic crisis, due to the current Covid pandemic. Fed Chairman Jerome Powell announced consideration of yield curve control. This action would result in a very deep negative real interest rate. It is highly likely that this will strongly impact the "moves" of the gold price chart in the coming time.
The relationship between central banks, gold price charts, and inflation
Correlation between real interest rates and inflation
In a market economy, the inflation index is the basis for central banks to conduct monetary policies and set appropriate interest rates for the market.
Therefore, low inflation, especially negative inflation, tends to lead to lower interest rates. Conversely, if inflation shows signs of increasing, central banks are forced to cope by raising interest rates to mitigate the impact.
The correlation between interest rates, inflation, and gold price charts
During inflationary periods, raising interest rates is a way to retain depositors. However, this is only a nominal adjustment; the real interest rate customers receive will decrease because it is net of the inflation rate.
Correlation between real interest rates and inflation
The Fed – the Federal Reserve of the United States, is responsible for shaping the country's monetary policy. Therefore, any decision by the Fed significantly impacts the US economy and the macroeconomic environment, including the gold market.
When the Fed tightens monetary policy, interest rates will rise. If interest rates rise faster than inflation, real interest rates will increase, negatively impacting gold's direction. Conversely, if the Fed loosens monetary policy, interest rates will fall. When interest rates fall faster than inflation, real interest rates decrease, which will positively support gold.
Gold price chart moves inversely to interest rate trends
The second correlation
After half a decade, investor sentiment has never changed. They still consider gold a safe haven when financial channels lose their appeal. This is a crucial factor in the US economy. When confidence in the US dollar wanes, traders immediately turn to gold. This can help the Fed better control the economy.
Thus, if the dollar attracts traders and inspires them into a developing economy, investor sentiment will immediately shift from safe-haven assets to riskier assets. In summary, the Fed's interest rate changes will, to some extent, affect gold investors. This action will impact the supply and demand in the gold market.
So, how does this relationship benefit investors?
Overall, the relationship between real interest rates, inflation, can help us predict the direction of the gold price chart. It helps to more clearly identify favorable and unfavorable periods for gold. This allows investors to make decisions on whether to sell, hold, or buy more. Sometimes, these observations also help you minimize risks during trading sessions.
Gold's brilliance in a gloomy economy
2020 was a relatively difficult year for the global financial market. The main reason was the outbreak of the Covid-19 pandemic, which directly affected the global economy. US unemployment rates continuously hit record highs, reaching 13.4% in the second quarter of 2020. The US economy also entered a recession, ending the longest growth cycle in history. Stocks plunged into the red, and real estate froze.
In contrast to financial market instability, the gold chart established a new upward trend
In contrast to financial market instability, the gold market was relatively buoyant. In the first three months alone, gold continuously surged strongly, surpassing the 1,700 USD/ounce threshold. This was the highest increase in over seven years, and it was expected to far exceed the historic 2011 peak.
Halfway through the year, by the end of June, gold prices had increased by a double-digit rate of nearly 18%. While the entire year of 2019 saw gold prices only rise by 18.4%. It is currently around 1770 USD/ounce, and there are signs of slowing down due to concerns about the economy reopening.
However, 2020 was a year of "crazy" growth for gold. It is not surprising that the gold chart will hover around the 2,000 USD/ounce mark in the coming months.
FED implements low interest rates for the first time
Faced with the strong impacts of the Covid-19 pandemic on the entire US economy, the Federal Reserve (FED) decided to maintain its interest rate at 0-0.25% after concluding its two-day meeting on June 9-10.
Accordingly, the public health crisis caused by Covid-19 will strongly affect economic activity, unemployment rates, and inflation in the short term. It will also have a minor impact on economic prospects in the short and long term.
The Fed is maintaining interest rates near 0% until the US economy stabilizes
The near 0% interest rate will be maintained until the US is confident that the economy has overcome current difficulties and is moving towards price stability and job creation. The FED also forecasts that these interest rates will remain unchanged at least until 2022. Furthermore, these measures aim to encourage consumers and businesses to borrow money, thereby stimulating the growth of the US economy.
Previously, to minimize the impact of the Covid-19 pandemic on the economy, the Fed injected trillions of dollars to support heavily affected businesses.
How does this decision impact the gold price chart?
The decision to maintain low interest rates, along with the upcoming largest support package in history from the Fed, has created a "whirlwind" for the entire economy, especially a new direction for the gold market.
These stimulus measures have helped gold prices make strong "comebacks," preparing for a new upward trend on the gold price chart. This comes after days when gold prices seemed to have fallen out of contention as the economic recovery gradually returned to normal.
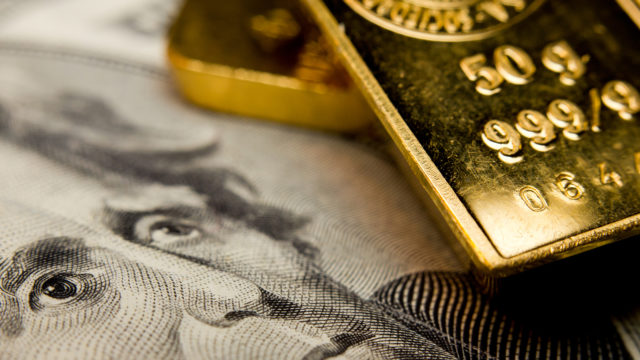
The implementation of low interest rates has helped investors turn to gold
Many experts believe that gold will set new price peaks around the 1800 USD/ounce mark, the highest price in the last 12 years. Investor sentiment will therefore also shift their "appetite" towards gold for a long time, given the Fed's projection of low interest rates lasting for two years.
Advice for investors when looking at gold price charts
According to Jordan Eliseo, senior investment manager at The Perth Mint, in the current risky economic climate, gold's upward trend is only short-term and can change at any moment.
Investors should learn more about the factors affecting gold through sudden price movements on the chart. From there, they can make decisions on whether to sell, hold, or buy. Furthermore, learning this will also help investors reduce risks during trading sessions.
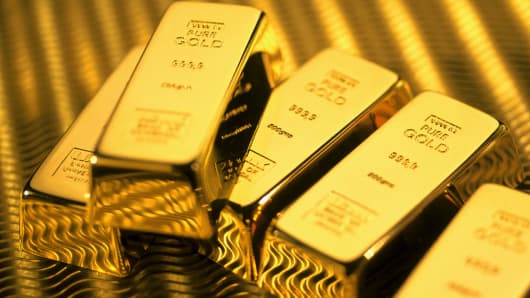
Investors should research before making trading decisions
Overall, the Fed's actions give gold investors much hope for a new growth phase. However, no prediction is accurate for such a volatile trend. Therefore, traders need to research carefully before making any decisions.
Hopefully, the above sharing will partly help you understand the impact of the Fed on the gold market. By internalizing the correlation between interest rates, inflation, you can predict the "moves" of the gold price chart.