














Trading Double Bottom Patterns in Gold Charts
Key Takeaways
- Double Bottom (Double Bottom pattern) is one of the common reversal patterns on the gold price chart. Due to its popularity, if applied well in analysis, investors can surely optimize a lot...

Double Bottom (Double Bottom pattern) is one of the common reversal patterns on the gold price chart. Due to its popularity, if applied well in analysis, investors can surely optimize a lot of profit. The following article will go into understanding this pattern, as well as the appropriate trading strategy accordingly.
Overview of the Double Bottom pattern in the gold price chart
The Double Bottom pattern, also known as the 2-bottom pattern, is one of the volatile reversal patterns. Accordingly, gold price fluctuations will reverse from downtrend to uptrend twice consecutively. The reversal rhythm occurs consecutively, forming a W shape on the chart.
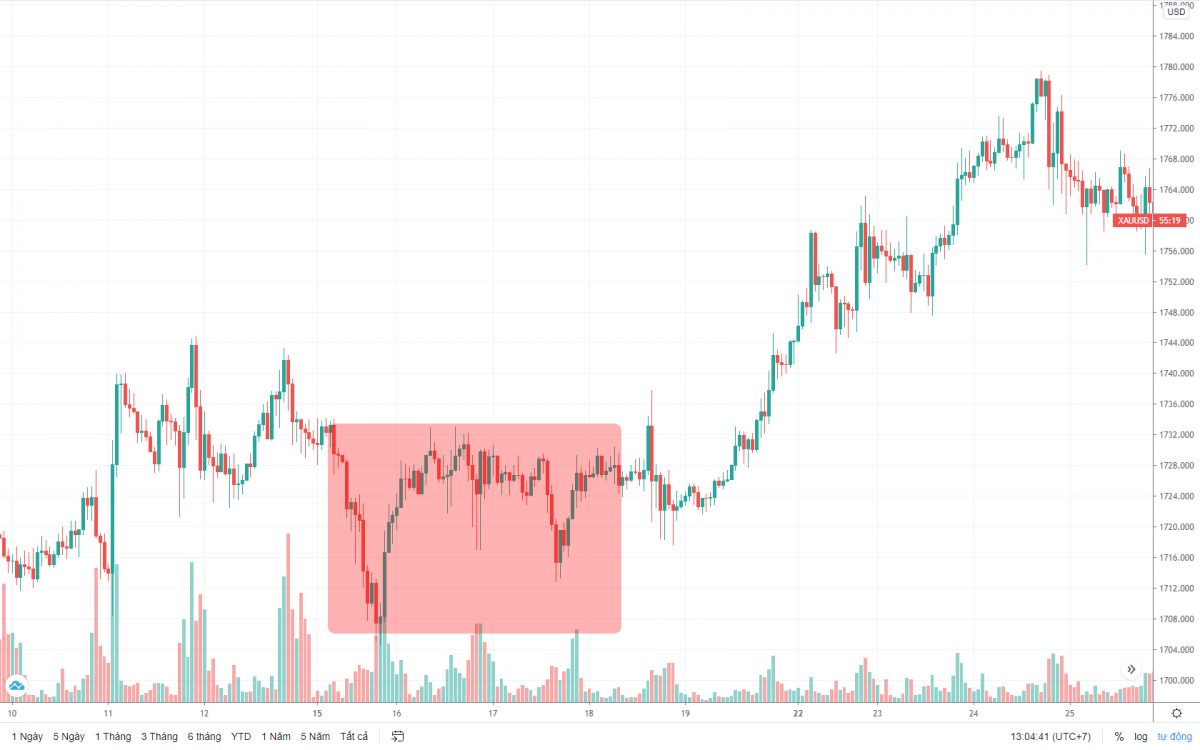
Gold price fluctuations will reverse from downtrend to uptrend twice consecutively
The appearance of this chart on the market is considered common and easy to identify. In terms of practicality, the signals emitted by the pattern are relatively easy to predict and recognize.
The accuracy of the Double Bottom pattern is largely determined by the time frame of the pattern. Accordingly, the longer the time frame, the higher the accuracy of the pattern.
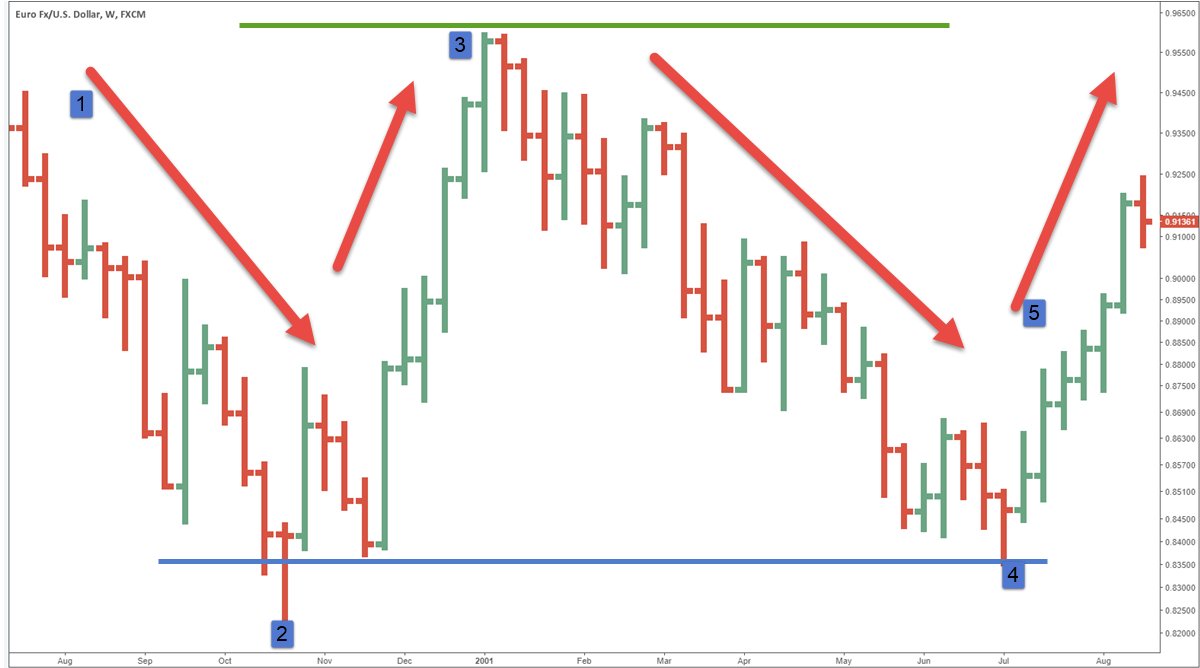
Simulation of the Double Bottom pattern on the gold price chart
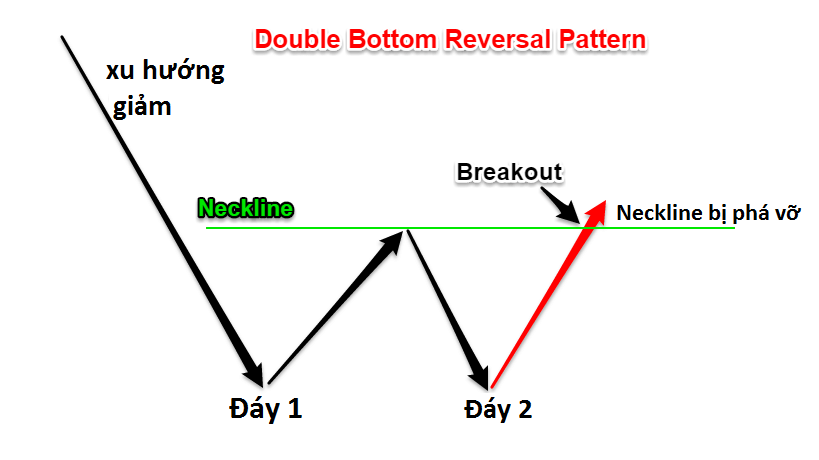
The Double Bottom pattern is formed as follows:
- Gold price fluctuations create the first support level, the falling price reverses to rise. The first bottom is formed.
- Gold price fluctuations then create a resistance level, the rising price reverses to fall.
- Gold price fluctuations continue to create the second support level, the price reverses again. The second bottom is formed, and the Double Bottom pattern is confirmed.
The idea behind the formation of the Double Bottom pattern is based on incomplete support levels. This creates pressure to form the first bottom. When this cycle repeats, the second bottom area will become an effective support area for investors.
Trading signals from the Double Bottom pattern in the gold price chart
When trading within the Double Bottom pattern, different trading approaches are needed at different times. For the first bottom, investors should make a "trial" trade with about 10 – 20% of their total capital to test the waters.
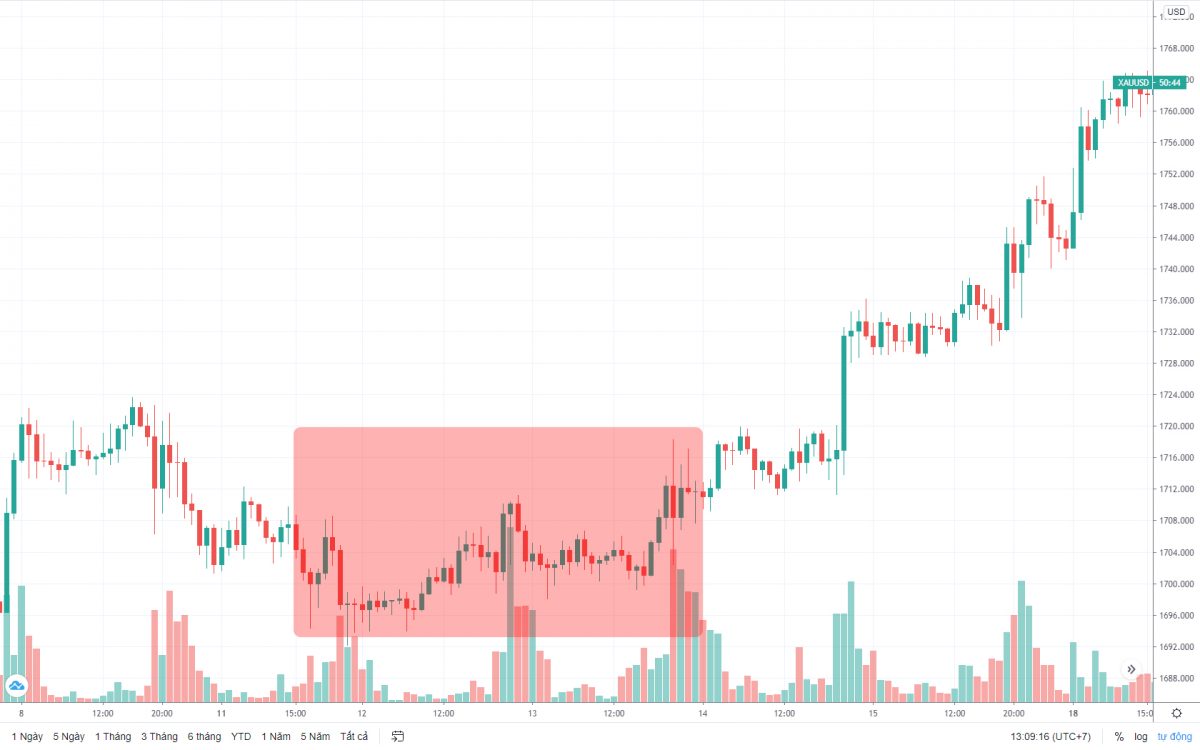
A Double Bottom pattern in reality
The greater the distance between the two bottoms, the higher the investment effectiveness. According to analysts, 3 months is the minimum condition for stable investment.
Therefore, when analyzing, experts recommend using daily and weekly gold price charts for observation. For charts with lower time frames, such as hourly, minute charts, etc., these charts do not have enough strength to help investors evaluate the market.
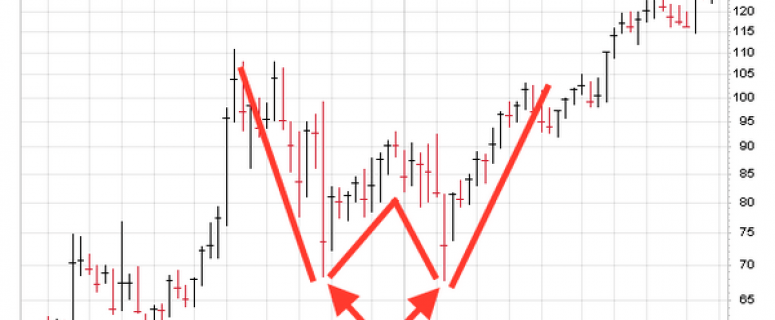
Pay attention to gold price fluctuations creating bottom areas, which are signs of future Double Bottom formation
The Double Bottom pattern provides strong reversal trend signals on the chart. The principles accordingly also respond to the market's volatility with this pattern. One of them is the COT index, which will also fluctuate strongly. Therefore, when the pattern is confirmed and the COT index increases sharply, the predictions are likely to be stable.
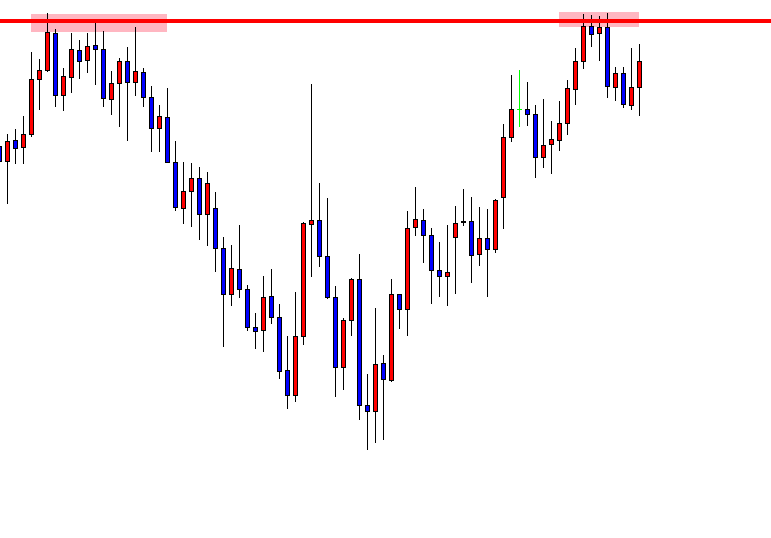
Trading according to the Double Bottom pattern in the gold price chart
When price volatility completes the first bottom, the resistance level expands, and the price will reach its peak. At this point, combined with the previous high trading volume, the market will have more opportunities to reverse.
Trading rules from the Double Bottom pattern in the gold price chart
In essence, to trade effectively with this pattern, one must identify the correct peaks and bottoms. Therefore, we need to wait for the pattern to be completed and intact with its fluctuations to trade effectively. Furthermore, the second bottom needs to be equal to or slightly lower than the first bottom. This is a prerequisite for the analysis and predictions to be as effective as desired.
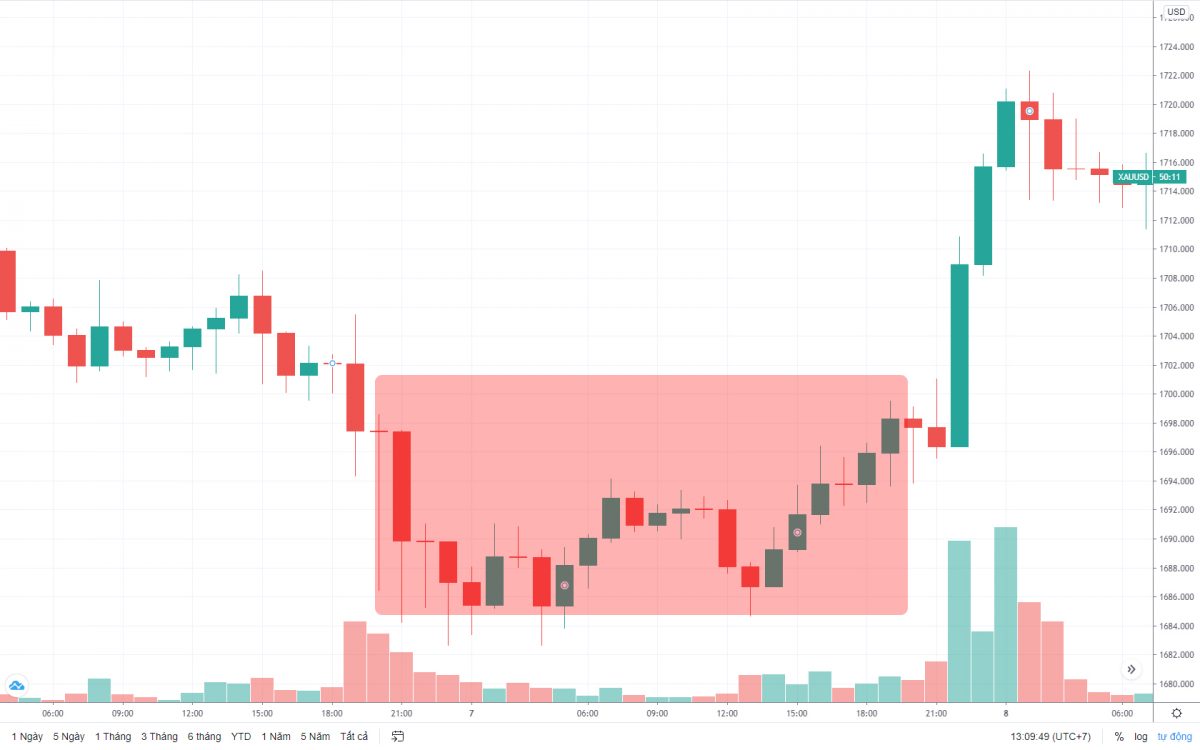
Correct signals will help investors take profits effectively
In addition, investors also need to pay attention to the following issues for effective trading:
- The first or second resistance level needs to occur faster and stronger than before.
- The two bottoms must have equal price fluctuations; if the second bottom is lower than the first, more signals are needed.
- Price fluctuations at the second support level must be higher than the first. Otherwise, the price pattern will be broken, and the trading session will consequently fail.
Identifying market volatility phases in the gold price chart
To trade successfully, the market must be in a downtrend, which is a necessary condition. This means that the appearance of the pattern alone does not guarantee the possibility of trading. Therefore, we need to correctly identify the market direction to make more accurate decisions.
Choosing the right time helps investors take profits effectively with the Double Bottom pattern
When price volatility is increasing or trading sideways without significant movement, the pattern is not effective.
When the pattern signals a downward movement, buying momentum will be higher, thus easily creating momentum for the market to move. This is what makes the pattern attractive and convincing in the market.
Determining the horizontal level of the two bottom points
One note that many investors often overlook is that the two bottoms of the pattern must be horizontal or equal. The acceptable difference is 2-5% compared to the appropriate level for this pattern.
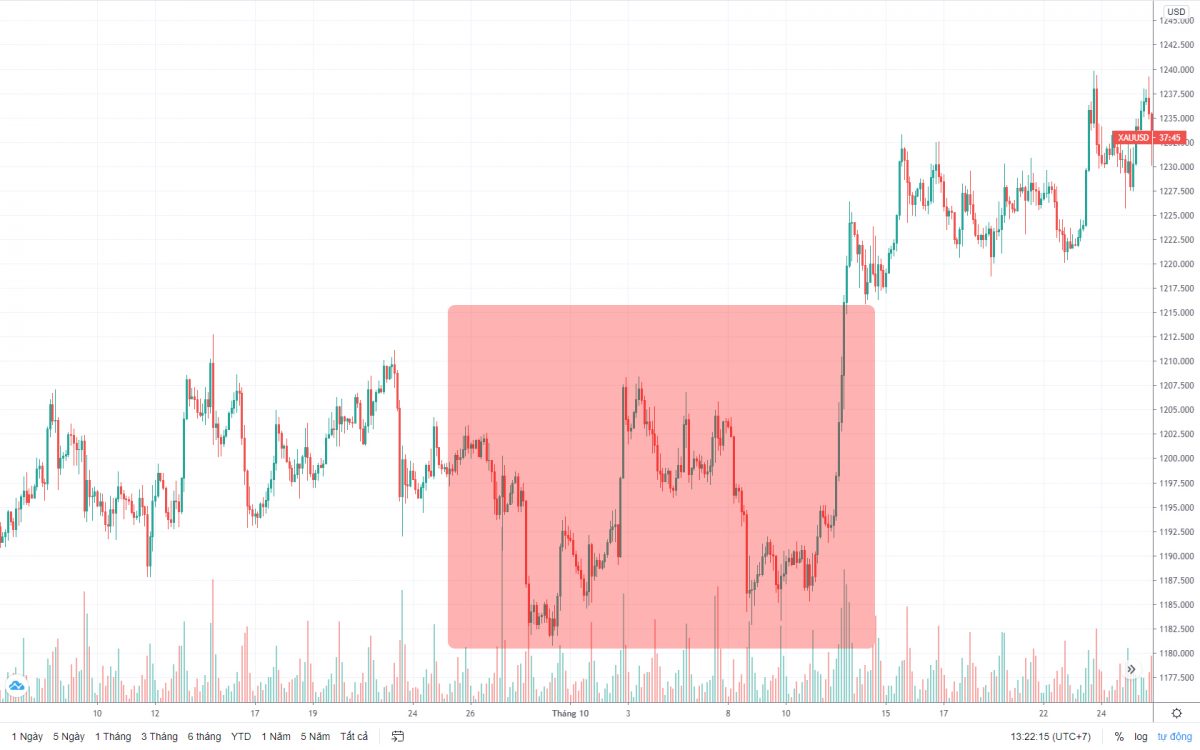
Pay attention to areas like this; it's an effective time for you to invest and take profits
In cases where the chart reflects price fluctuations at the two bottoms with a large difference, especially if the second bottom is lower than the first. Investors need to use other data for evaluation, such as candlestick patterns providing reversal signals. Or divergence signals from indicators are also considered suitable and effective suggestions.
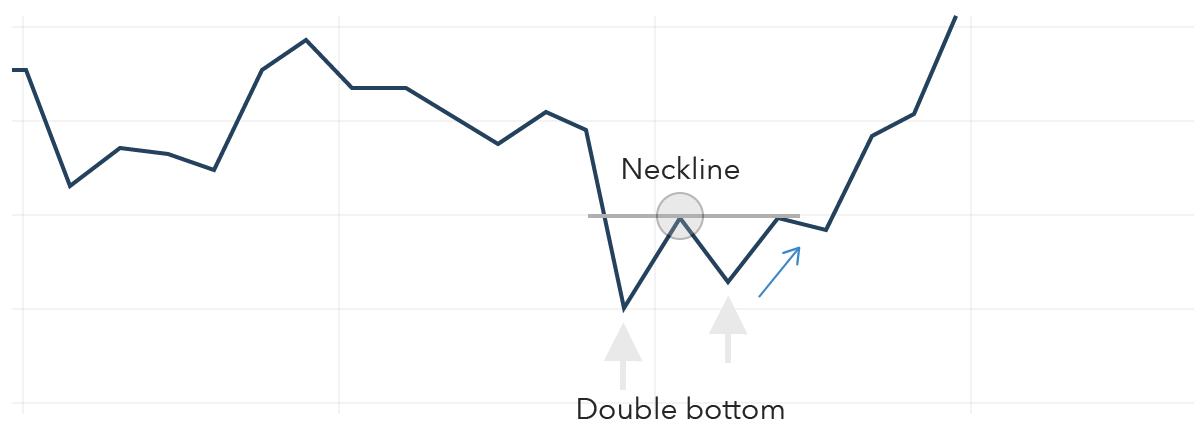
Simplified chart for the Double Bottom pattern
In reality, it is almost impossible for the Double Bottom pattern to have two exactly equal bottom points. Therefore, based on the situation and specific measurements, investors can devise appropriate strategies. This helps investors better assess risks and predict the market more confidently.
The crucial phase for effective profit-taking
After identifying the market trend and the characteristics that form the Double Bottom pattern. Investors should not rush to take profits immediately but need to wait for the appropriate time.
The effective time to determine the profit-taking point is after the second support level. The effective profit-taking time is when the price volatility at this level is higher than the previous level (neckline). When this signal exists, it is also the time when investors can complete the trading session to take profits.
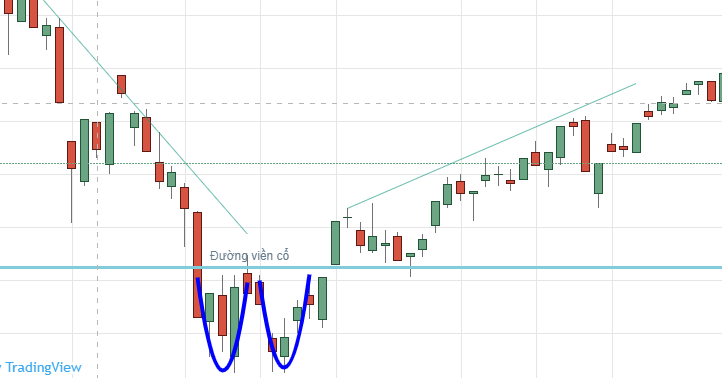
Price fluctuations after the Double Bottom pattern tend to reverse
Limitations of the trading strategy using the Double Bottom pattern
Although the Double Bottom pattern is very effective and widely used in trading, it is not without risk. What makes this pattern risky is the inability to precisely and completely determine the rules.
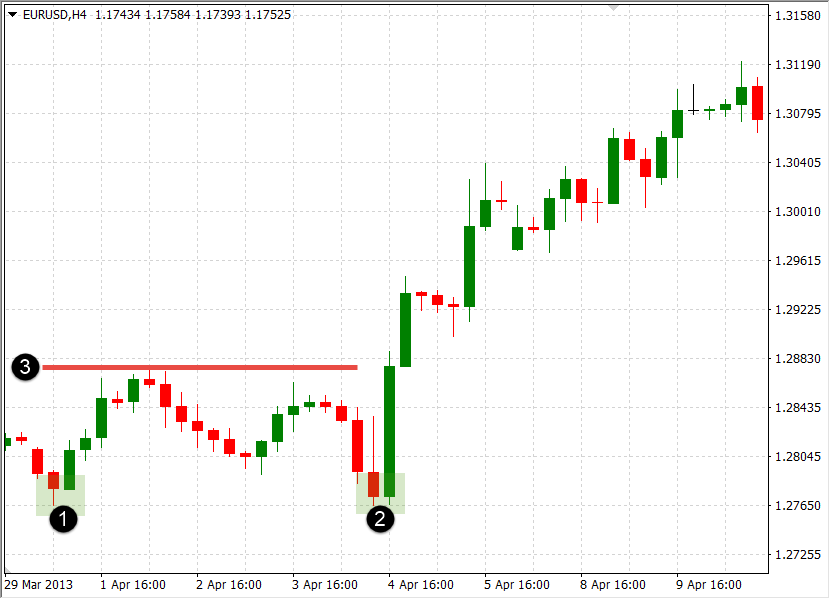
Be very careful and highly determined to take profits effectively during this phase
Therefore, to avoid this risk, investors must be cautious and use more technical indicators. This allows for a broader, overall picture of the gold market. In order to make appropriate moves and win each battle in your own financial war.
Overall, the Double Bottom pattern provides investors with a lot of useful and important information. Based on which, each investor can build their own suitable trading strategy. However, no matter what happens, always maintain your spirit and avoid making decisions in haste or with insufficient information.